Maps
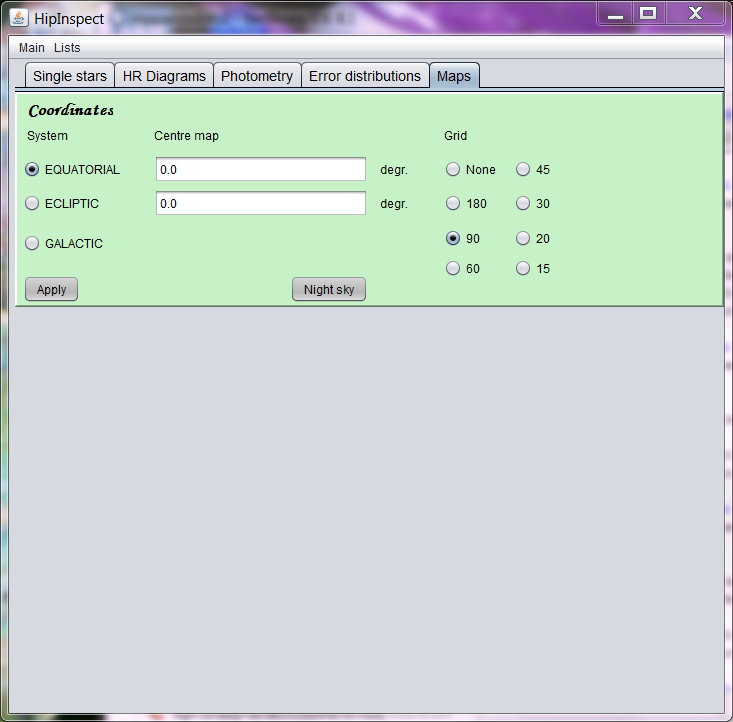
In this section full-sky maps can be produced in Hammer-Aitoff projection, in Equatorial, Ecliptic, or Galactic coordinates, showing a coordinate grid, stars up to a specified magnitude, and constellation boundaries. The start-panel asks for choosing the coordinate system and setting the grid spacing. The centre of the map, in the chosen coordinate system, can also be set here. The default centre is the Vernal Equinox.
Two buttons are available at this stage. The Night Sky button is used to create a map of the sky with a horizon, adjusted to the time and location of the observer, using the interface below.
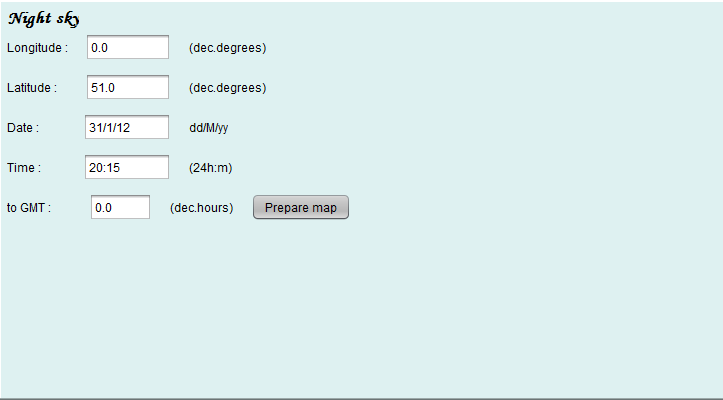
The Prepare map button leads to the same actions as the Apply button on the preceding panel.
After pushing the Apply button the user is first asked for setting the colour of the coordinates grid. A light colour is usually best for that purpose. Once this is done, the second selection panel is shown:

The second panel has the options of adding constellation boundaries to the map, stars up to a specified brightness in Hipparcos magnitude, and additional grids. Additional grids are always those not already used. When additional grids are requested, the user will be asked to set the colour to be used for those grids. The button Show Map then exposes the window with the map.
Display Map
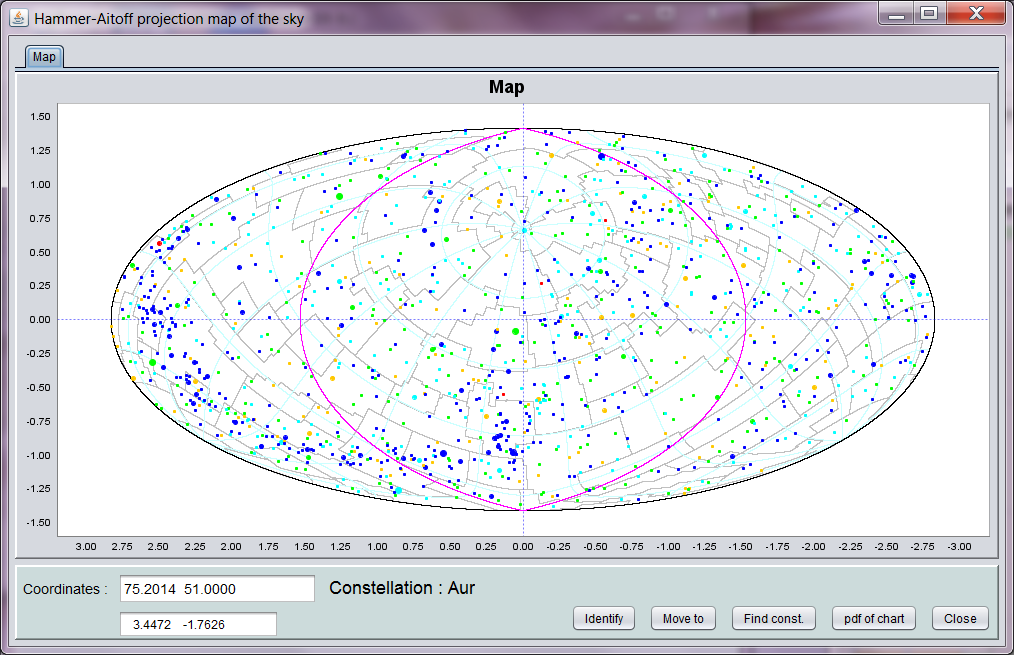
The night-sky map show the sky with the zero point (zenith) set according to the coordinates of the observer, and the date and time of the observation. It also shows the horizon for the observer. The main difference when going directly to the map is that the zero point will be as set on the first panel, and no horizon is shown. The stellar images are sized according to brightness, and coloured according to spectral type, from blue for O and B stars to red for M stars and later. The constellation borders date back to the 1875 equinox, and do therefore not exactly align with ICRS grid lines.
The coordinate position of the cursor on the map and the constellation corresponding to that position are shown on the lower panel. The button Find const. shows a window with all constellations:
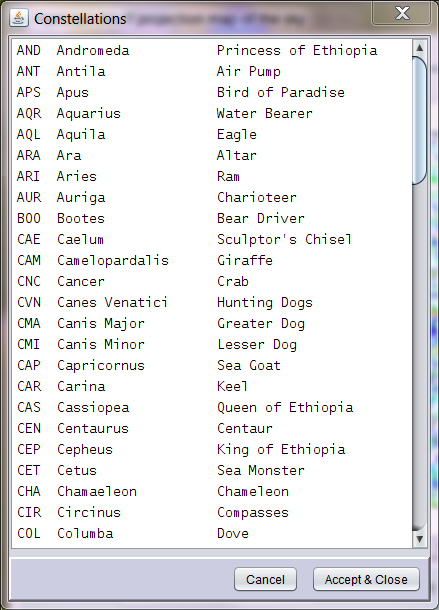
Highlight the required constellation, and push the Accept & Close button. The borders of the requested constellation will now show in red on the map, as is shown here for Taurus:
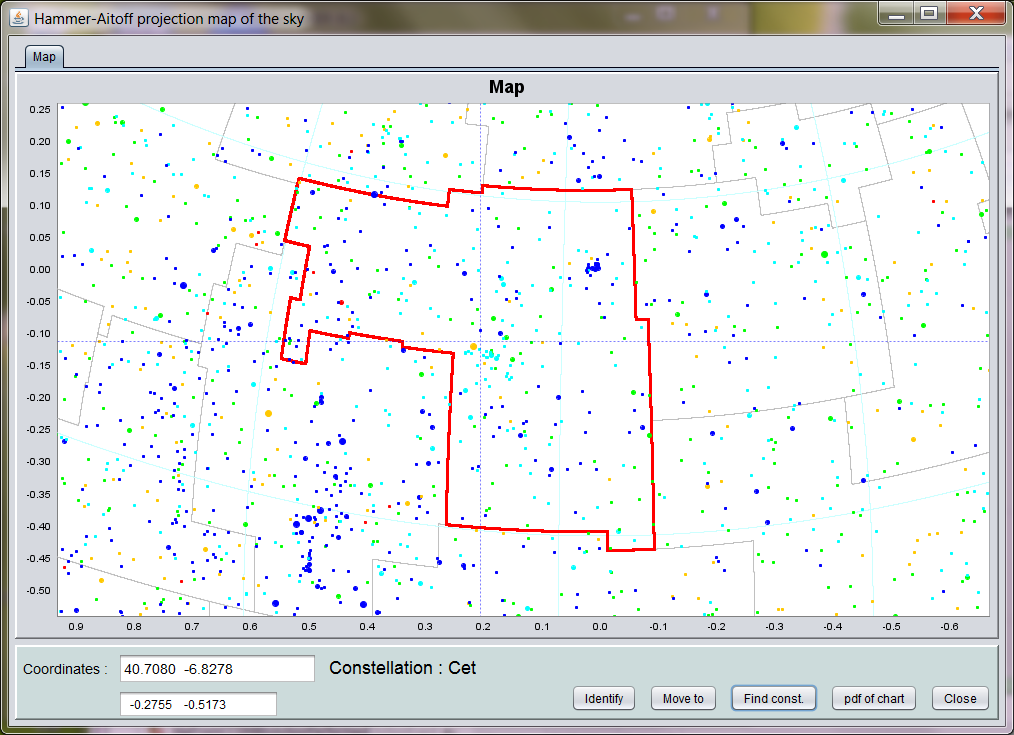
Here the are of the map has been zoomed into, using the standard JFreeChart right mouse button menu option Zoom in, Both axes. Because the charts are vector graphics, zoom in can reveal any detail contained in the original data used for creating the chart. An example is shown here for stars in and around the Pleiades cluster (also visible in the graph above):
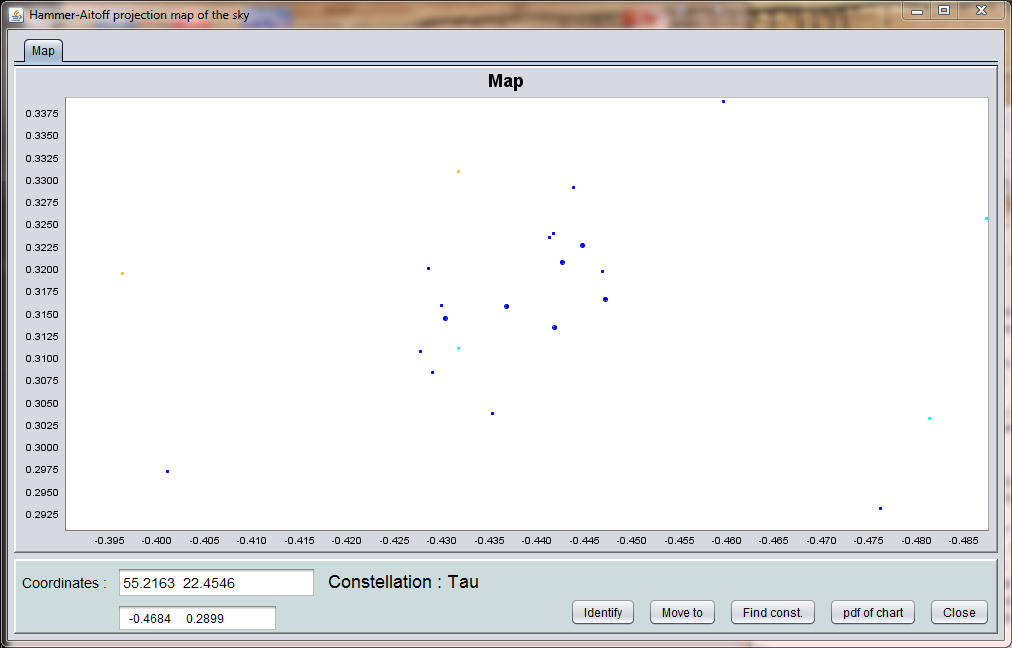
The button Move to changes the centre of the map to either the centre of the selected constellation (if available) or the position of a point on the map as set with the cross wires and the left mouse button. The map with its contents will be re-drawn with the new zero point as specified. As in other charts, the cross-wires and left mouse button can be used to locate and identify each data point. Pushing the Identify button will show the Summary information window for the identified source.