Details astrometric solution
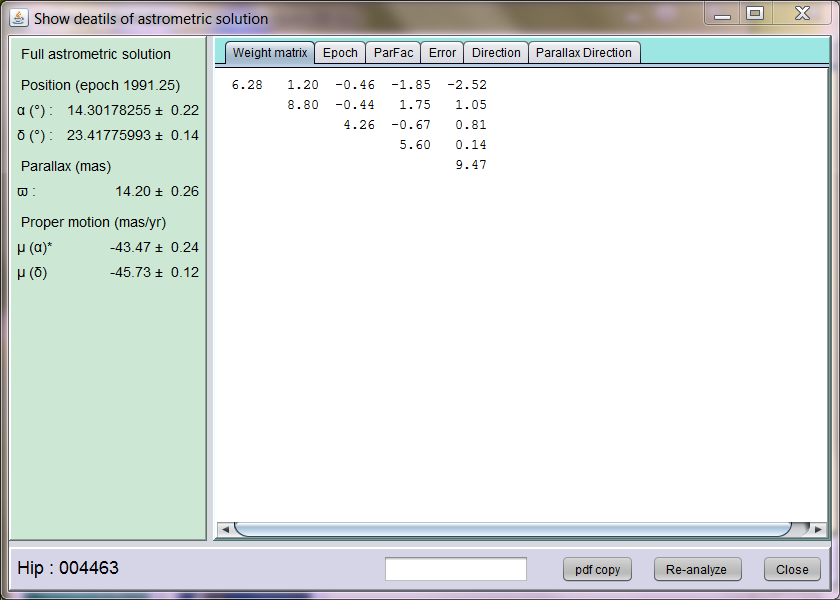
The detailed astrometric solution window is accessed from the Astrometric Information tab on the Summary Information window, and provides further details on the applied astrometric solution:
- the weight matrix, which is an upper triangular square root of the normal equations of the least squares solution, as directly obtained through Householder transformations, and which condenses the available astrometric information;
- the residuals and their standard errors as a function of epoch of observation;
- the residuals and their standard errors as a function of parallax factor;
- the residuals and their standard errors as a function of the standard error on the residuals;
- the residuals and their standard errors as a function of the scan direction;
- the parallax factor as a function of the scan direction.
The weight matrix can be used as a prior in an astrometric solution using Hipparcos data combined with new, independent measurements. For that it needs to be complemented by the right-hand side of the equations and the square root of the sum of the squared residuals, both of which are direct outputs from the Householder-based least squares solution.
The re-analyze button activates a new window, in which variations on the astrometric solutions can be tried out. This option is still partly under development.
Residual epoch dependencies
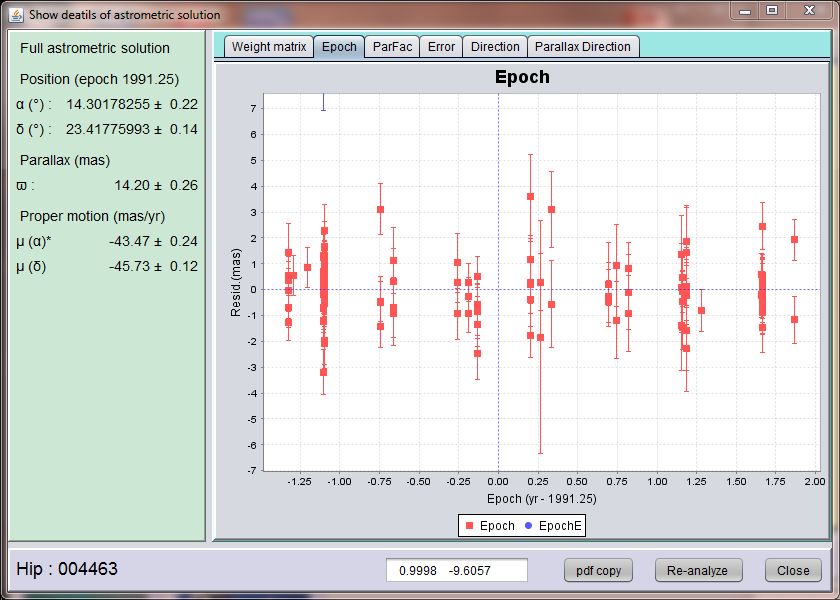
Residuals as a function of epoch of observation are shown in the chart above. With each residual is shown the 1σ error bar as used in the solutions. However, the interpretation of these residuals is complicated, as they refer to different scan directions. Residuals shown in blue were rejected by the astrometric solution. The distribution of epochs of observation over the mission is very much a function of ecliptic latitude. Clusters of observations are seen when the local scan direction is close to perpendicular to the direction from the observation to the direction of the Sun on the sky. This also corresponds with a small to zero parallax factor for these observations.
Residual parallax factor dependencies
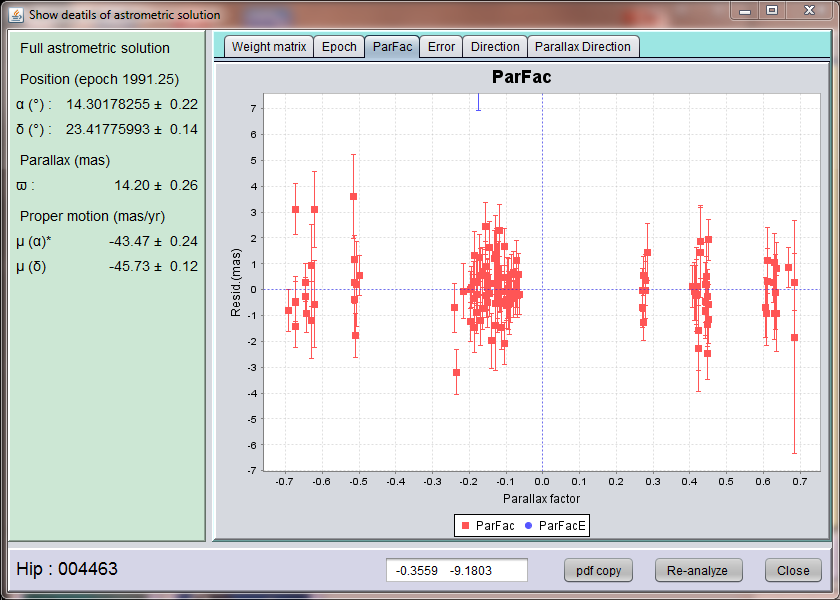
The parallax factors in the astrometric solution represent the dependence of the along-scan residual on a change in the parallax value. The parallax factors depend on position on the sky, epoch of observation and scan direction. Close to the ecliptic pole the parallax value is always close to its maximum value of around 0.7, while near the ecliptic plane the values vary between 0 and 0.7. For a small number of sources concentrations of parallax factors equal to zero are found, even close to the ecliptic pole. These originate from observation in Sun-pointing mode, when scan direction over the complete scan circle is at a 90 degrees angle with respect to the direction on the sky of the Sun.
Residual standard error dependencies
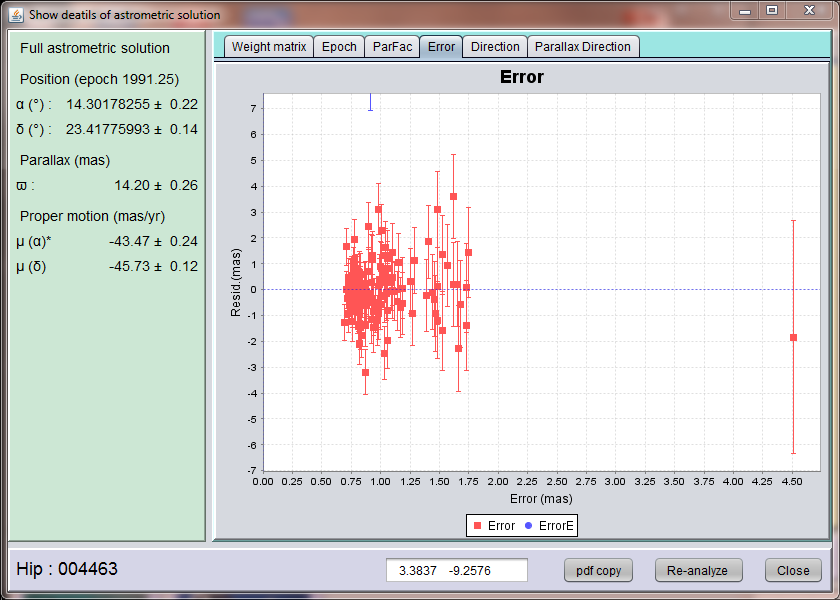
The residuals and standard errors plots can show the presence of unresolved systematics in the data, and show how the data is distributed over dependencies that determine parallax and proper motion. Modelling errors in the astrometric solution can show through higher than expected variance of the residuals for the highest accuracy measurements. The 1, 2 and 3σ error boundaries in this diagram are simply straight, diagonal lines.
Residual scan direction dependencies
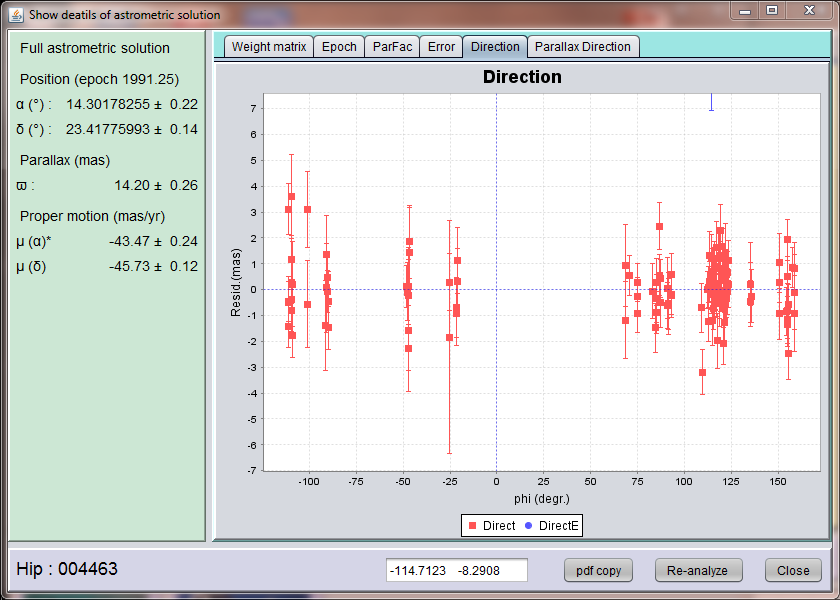
The error dependencies on scan direction show two properties of the data, the distribution over scan directions and possible dependencies of errors on those scan directions. The distribution over scan directions is very much a function of ecliptic latitude, with the most homogeneous coverage around the ecliptic poles. Near the ecliptic plane scan directions are limited to values within about 50 degrees from 90 and 270 degrees.
Parallax factor and scan direction correlations
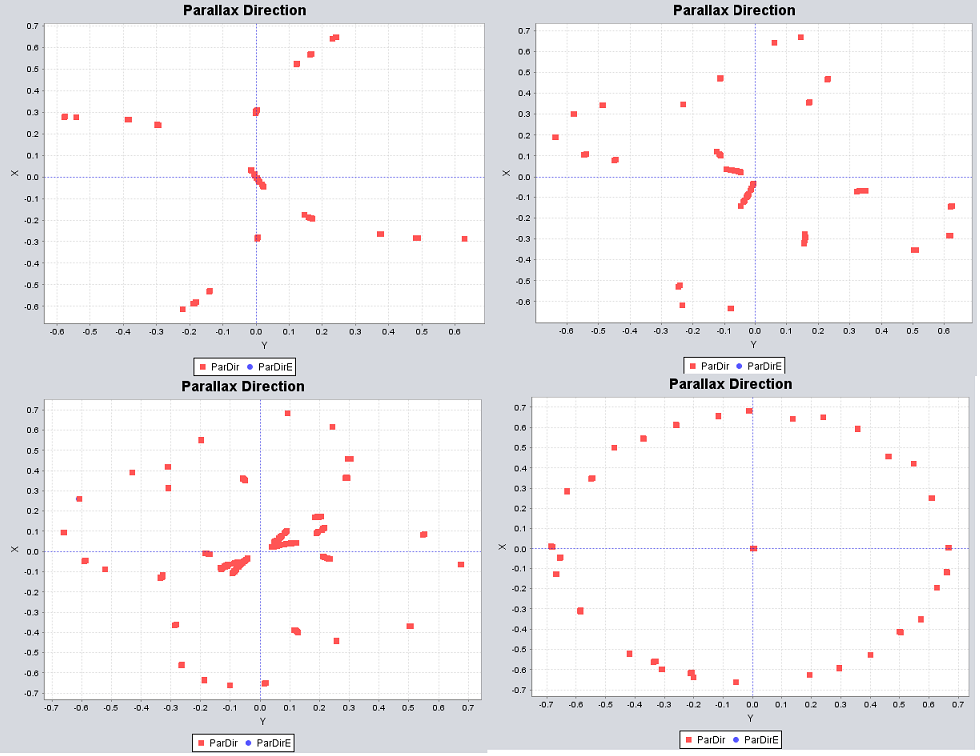
The distributions of scan direction and of parallax factor with scan direction give some insight into how the parallax, proper motion and position determination can be correlated. These distributions are very different for observations near the ecliptic pole, the zones at ± 43 degrees, and close to the ecliptic plane. This is shown in the Figure above for the relations between scan direction and parallax factor for four different ecliptic latitude positions: top left: 0 degr.; top right: 30 degr.; bottom left: 43 degr.; bottom right: 90 degr. Clearly visible in the plot for 43 degrees latitude are the large number of observations with very small parallax factors. These originate near the nodes of the precessing scanning circle, where the direction on the sky of the Sun is perpendicular to the scan direction. The point t the centre of the 90 degr. graph is the result of measurements during Sun-Pointing.